Do Coaches Add Value?
Super Rugby Coaches, 2026

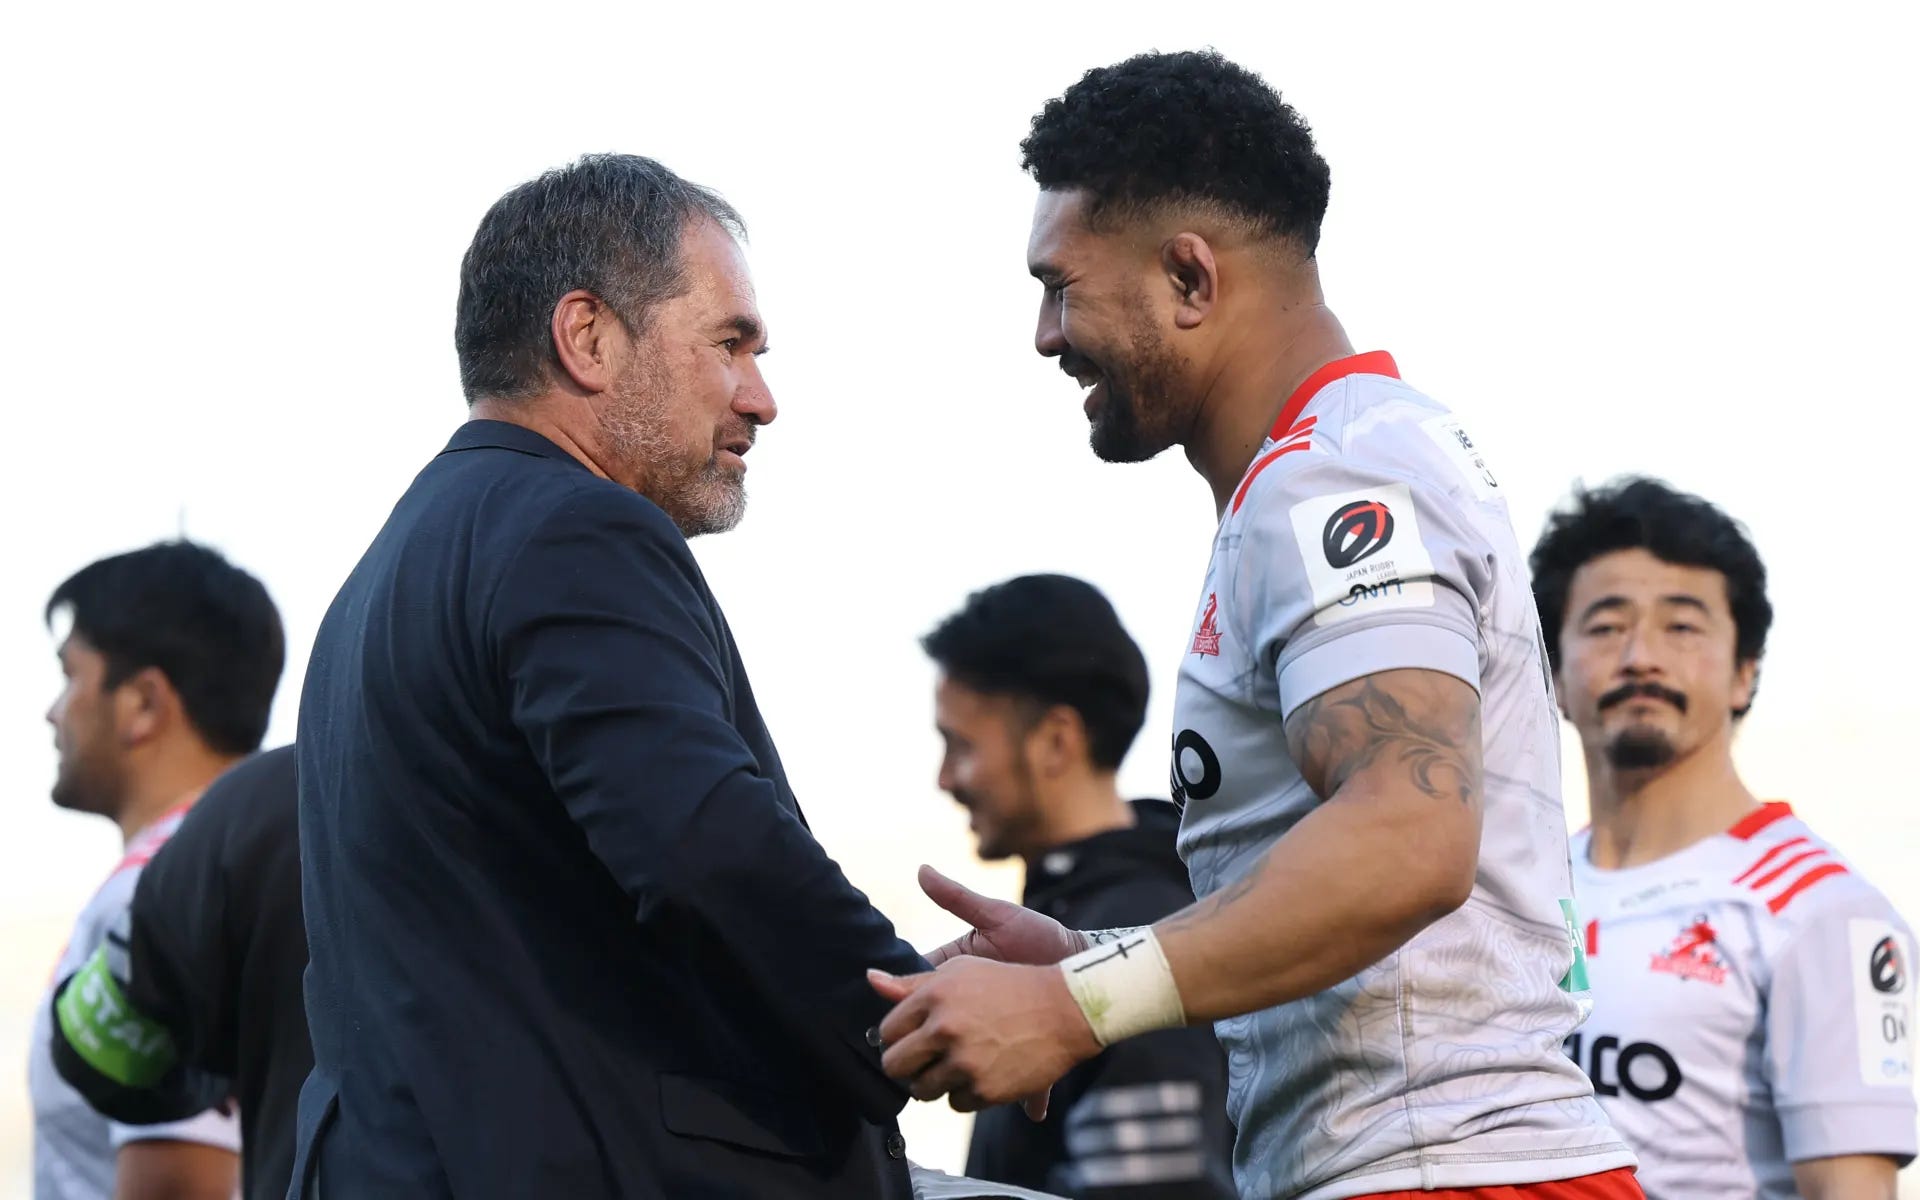
Dave Rennie and Ardie Savea at Kobe, image: www.photosport.nz
At this time of the year I assess the performance of Super Rugby coaches. My straightforward approach is to highlight coaches whose teams have done better than would be expected given the depth of talent they have on their team.
That is, given the number of All Blacks on their team, how well has their team done in terms of points differential (points for minus points against) during the regular season (not the play-offs).
The Hurricanes did well in the final (what a points differential that was: 60 for, 5 against!), and all through the season – averaging 40 points for and 21 against across the 14 regular season games). In Dave Rennie’s pick for the new All Black team the Hurricanes have contributed more players than from any other franchise (12 of the 34 players, or 35%).
Points for and points against are an obvious metric of performance. A model of rugby performance developed by Oleh Krasnytsya and fellow researchers across teams in the European Rugby 15 Championships included tries, conversions, missed tackles and offloads. Points for and against is simpler but gets to the essentials of performance.
You will have noticed in World Cup football coverage and in recent rugby screening a graphical summary of the waves of pressure being applied by each team. These wave forms illustrate the probability of each team scoring in the near future. Given who has possession, where they are on the field, how many phases have been completed, the state of the game (score and time remaining) and the current type of play (set-piece, open play).
As the probability of scoring grows, the wave builds.
These “pressure wave” approaches tell us what is happening. Points and points differential tells us what has happened.
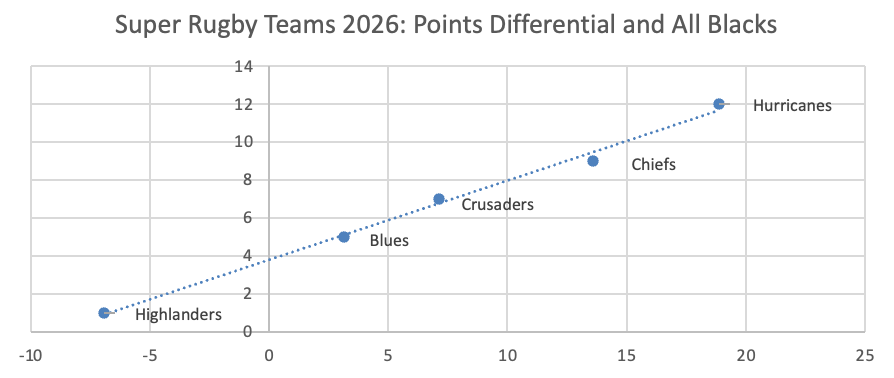
I have a remarkable chart to show you the relationship between the talent in each of the five New Zealand teams (the number of All Blacks on the team) and that team’s regular-season point differential. From the Highlanders at the bottom left – one All Black (prop Ethan de Groot) and a points differential of -7, to the Hurricanes at top right (12 and +19), there is a straight line connecting all team’s All Blacks and points differential coordinates. In statistical terms, this line explains 99% of the team’s performance.
Maybe Dave Rennie is a reader of my previous Newsletters – and simply deduced the number of players he needed from each franchise from their points for and against?
Does this mean that the coaches added nothing to the mix? Of course, they just had to choose the right players, train them, and build a performance culture across the team. It seems all five coaches did a good job of that. Unlike last year, when (“Stern”) Vern Cotter did better than other coaches with the players he had. This year, the Blues were strongly forward-focused, with little opportunity for their backs. This is reflected in the 3:2 forward-to-back ratio selected from the Blues franchise by Rennie – the highest ratio of forwards to backs from any team (excluding the 1:0 selection from the Highlanders).
In contrast, the Hurricanes and the Chiefs were more balanced in the proportions of forwards and backs – as selected for All Black status (6:6 and 5:4 respectively). Consequently, the Hurricanes and Chiefs did better on attack – controlling territory, sustaining possession pressure and forcing opponents into low probability positions. Now that Rennie has the balance sorted out, he just needs to work on training and team culture. He has Ardie Savea to help with that final area.