Historical heights
Height gives an indication of wellbeing


Image: USA Today
Height is highly heritable and also sensitive to early childhood nutrition and disease. In other words, we are born with a potential to grow to height x, and if during our infancy or childhood there is a squeeze on protein or a life-threatening infection we don’t get to that potential height. Our body puts its limited resources into keeping us alive and that could mean a stunted future.
These effects are illustrated in some compelling charts produced by Our World in Data – one shows how height is related to infant mortality – a tough world for young people results in them being shorter in later years.
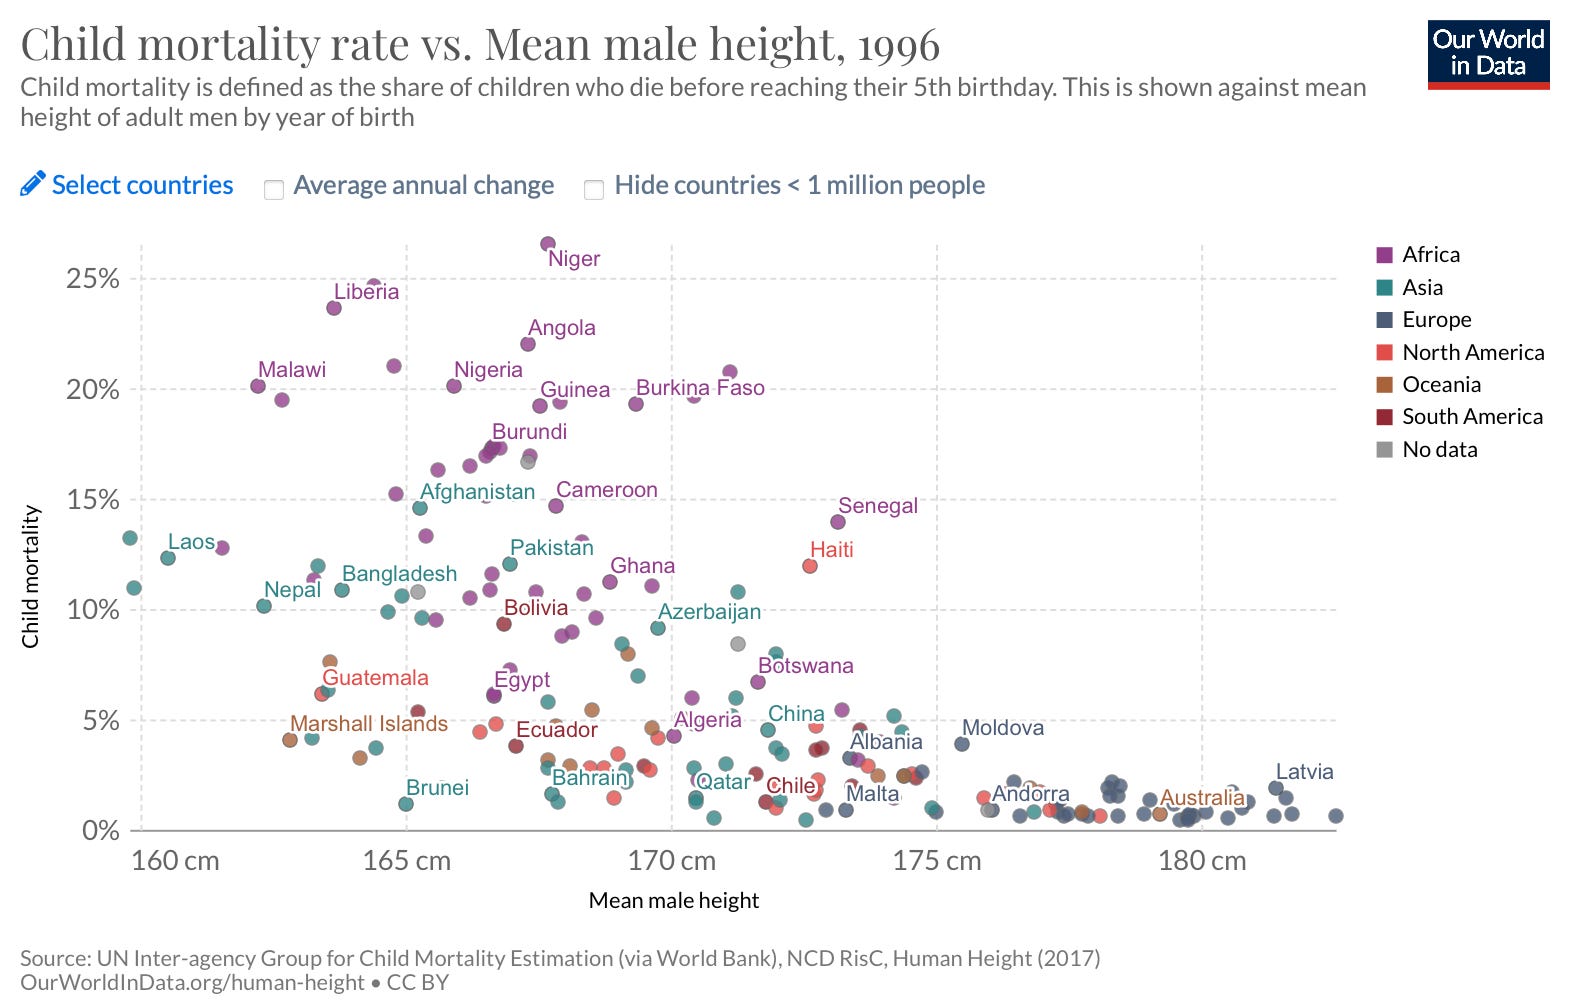
We can see height differences between countries, and also differences through time. That includes people from way back before anyone had invented GDP or had got around to surveying happiness.
Peter Turchin (writing in Ages of Discord) uses a collection of measures, including the height of adult Americans over the years 1780-2000, to illustrate how wellbeing changes over these 220 years (people’s height increases to the early 1800s, drops to a low at the turn of the century – around 1900, peaks again in the 1960s, and since then – Americans’ height appears to be going down again).
Turchin’s point is that changes in average height cycles are in sync with real wages, life expectancy, age at first marriage and migration levels. All of these measures, he proposes, are indications of how good or tough life is.
Turchin proposes that these cycles are driven by the elite putting the squeeze on ‘commoners’. As the elite gain power, they encourage immigration and force down wages – so making more for themselves and making life tough for those they oppress. This ultimately results in stunting the growth of the children of those at the bottom.
This is illustrated with data from the nineteenth century contrasting the heights of the privileged sons of the upper-class attending Sandhurst Military Academy with the sons of lower-class families attending a Marine Society – the average difference (in the top chart below) in the height reached 22 cm (8 1/2 inches) at age 16.
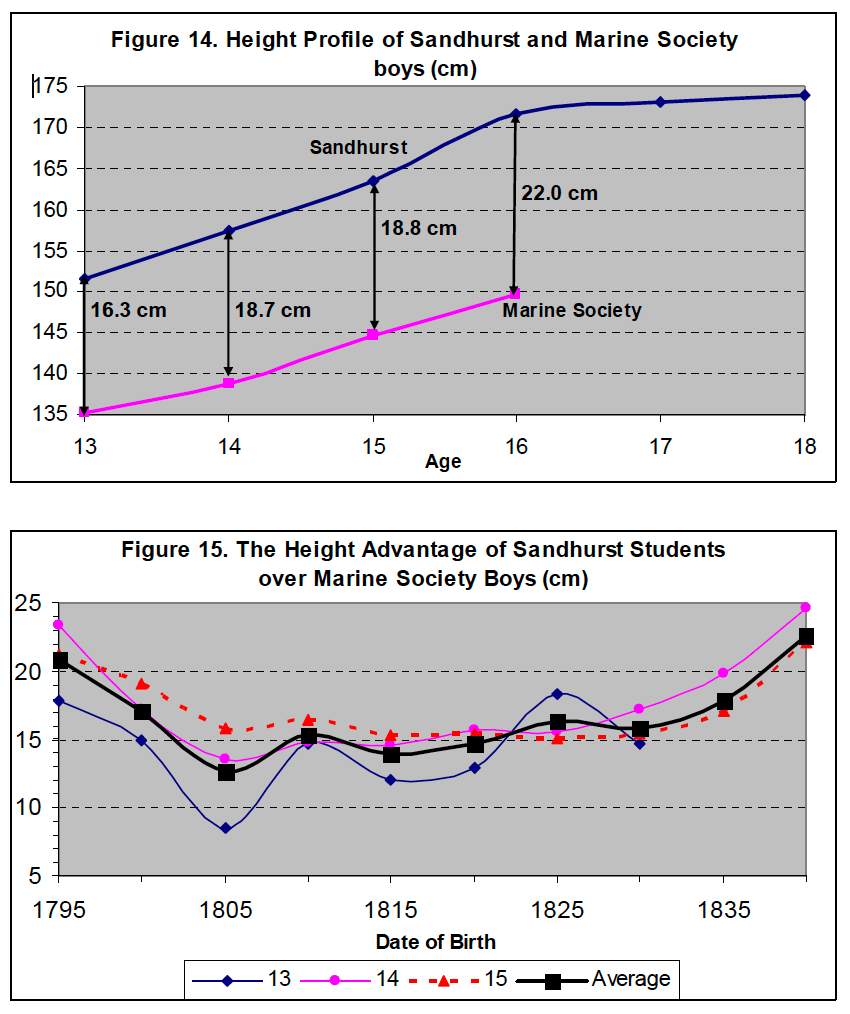
This class-based height difference varied over time (as shown in the bottom chart) – reinforcing Turchin’s point – that there are cycles of wellbeing, especially for those lower in the social hierarchy.
Research by Kris Inwood and colleagues used a range of data sources to track the height of New Zealanders since the 1840s. They contrast the height of Māori with New Zealand born Pākehā over these times. The most compelling results are shown below.
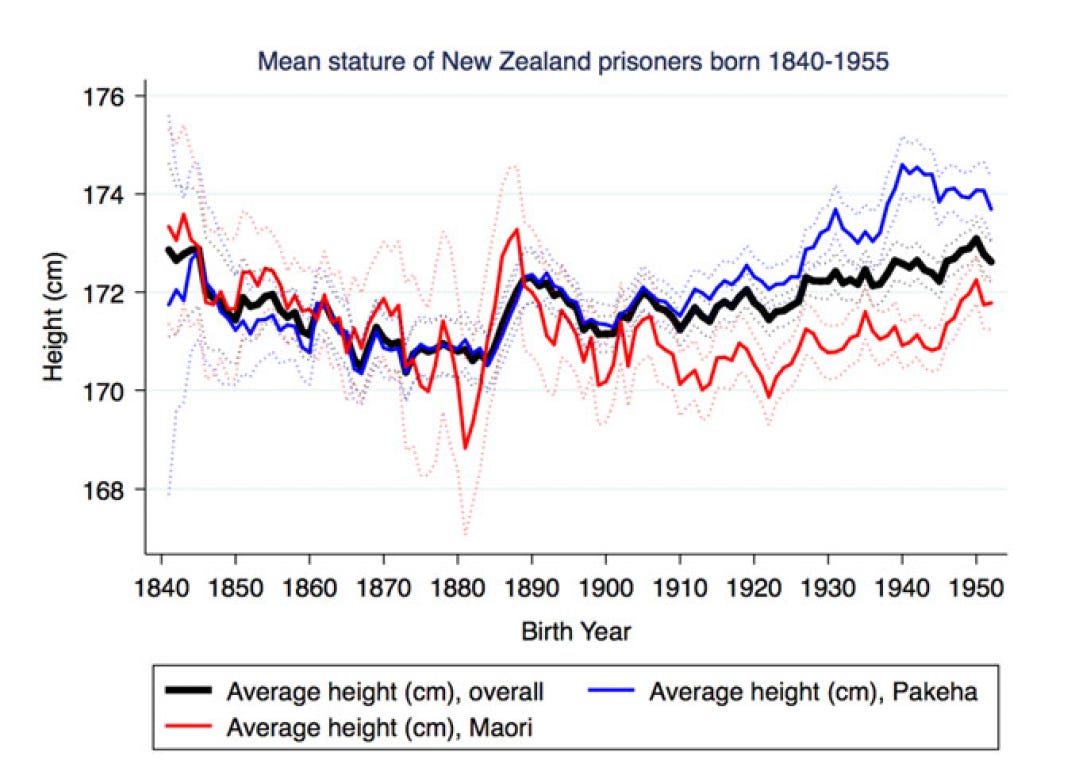
On the x-axis are birth years of those measured 21-49 years later. This is Māori and Pākehā prisoners (nearly 24,000 in total), and so might be considered unrepresentative. Inwood’s team confirm these data with the heights of Māori and Pākehā who were measured when enlisting for World Wars 1 and 2. From no difference between Māori and Pākehā through the 19th century to a more than two-centimetre difference in the 1950s is a graphic illustration of the impact of colonization.
Inwood’s results also indicated class differences – farmers and professionals among those enlisting were taller than other occupations. And to return to Turchin’s theme of historical cycles – the chart shows an overall concave curve for both Māori and Pākehā, with a low point in the 1880s – although clearly Māori and Pākehā follow different tracks of improved height after then.
Clearly, there is still a need to lift Māori further – and with height we have an objective measure (along with life expectancy and others) of our progress.
Stewart Forsyth is an organisational psychologist and executive coach and also the author of 21 Remarkable People – available from Amazon or Apple or other eBook sources.