

An illustration of the steep drop from the peak to the plains: A somewhat idealised view of Mount Taranaki, Charles Heaphy, 1840
In 1988 Pal Enger put a ladder up against the wall of the National Gallery in Oslo. He broke a window, climbed in and found he’d chosen the wrong window. He was after Edvard Munch’s The Scream. But the painting by this window was Love and Pain (also by Munch). He stole it anyway. He got busted and went to jail for three years.
Enger did more than one spell in jail but did well stealing jewels and artworks. The Economist’s obituary describes how he owned the only Porsche in Oslo. People would come by at the weekend to watch him washing it.
Six years later he chose the right window. He had visited the National Gallery twice weekly in the last three years. The Scream was mostly unguarded, the painting was unglazed, and it was by a window. He chose the day of the opening of the 1994 Winter Olympics to make his heist. this time he got The Scream. He left a thank you note.
It was not possible to sell The Scream. But he was tricked into doing a deal, and again busted.
We could describe Enger as a career criminal. He kept on thieving and he did a lot of it. Is his reasonable success in this career an indication of someone we could consider in the upper range of the “normal” distribution of those in this milieu? Or was he something exceptional?
In a classic paper on successful people in a range of more conventional careers (The best and the rest: Revisiting the norm of normality of individual performance) Ernest O’Boyle and Herman Aguinis reviewed individual performance in politics, entertainment, sports and research. They looked at whether performance was distributed “normally”, that is in terms of the “Bell-shaped” (or “Gaussian”) curve we have seen in our statistics texts. But no. A few of these performers knocked it out of the park. And knocked the distribution out of “normal”.
Performers were not distributed in a gentle hill shape with a few individuals at the high-performance end (or the other end). Instead, the high performers were stacked at one end of the distribution with fewer and fewer below them – stretching out like the side of a mountain (check out the near-perfect shape of Taranaki – from very steep at the cone to near flat across the surrounding plain). This is a “Paretian” or “power-law” distribution. As O’Boyle and Aguinis put it – there were “the best and the rest”.
O’Boyle and Aguini measured the performance of 633,263 individuals. The biggest chunk were 450,185 researchers working in 54 academic disciplines. The performance measure for researchers was publication in top-tier journals – pretty relevant in the “publish or perish” world of science.
The distribution of the number of publications across individuals was “Paretian” rather than “Gaussian” across all of the 54 disciplines (see Panel a in their figure below). There were the best, and then a rapid drop-off to the rest.
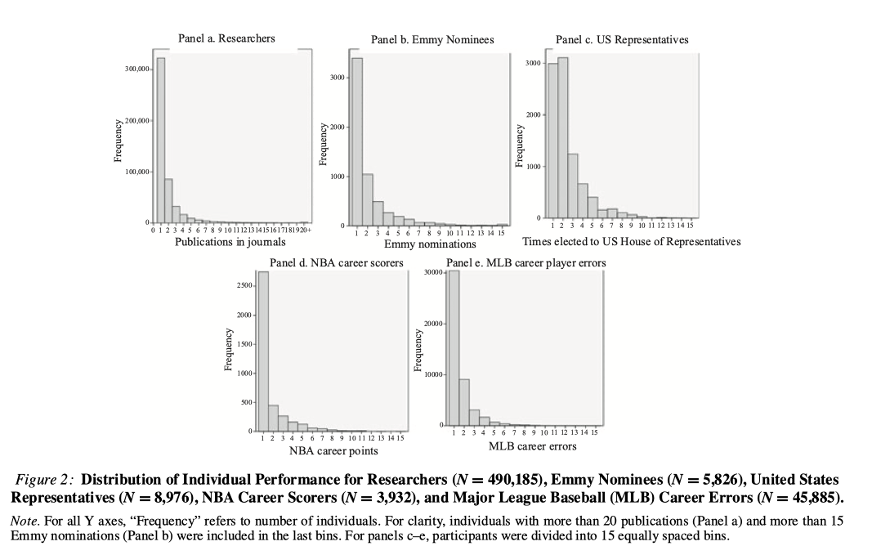
From O’Boyle and Aguinis, 2012
O’Boyle and Aguinis also assessed 17,750 entertainers (who won Grammys or made it onto the New York Times best-seller list for example). Also, 42,745 political candidates from 10 countries (including New Zealand) were assessed in terms of how many of them won elections and how often. They assessed sportspeople and sports teams across a range of sports and countries. In each field the pattern was similar – the best, then the rest. A steep drop-off from the top performers, as shown in their summary charts.
These innovative researchers also looked at misbehaviour. Particularly the bad behaviour of sportspeople. For example, yellow cards in the English Premier (football) League. This survey included 57,300 athletes in six sports. Again the same pattern, except now it was the worst who were the top performers, then the others. O’Boyle and Aguinis noted that some sporting superstars were also supervillains.
Sure, it’s macabre, but – does the same law apply to career criminals? Are a few of them super-criminals? Is Pal Enger’s relentless commitment to his career (all those visits to the National Gallery) functionally similar to the efforts of top athletes or research scientists?
The answer seems to be yes. A few “career criminals” do a disproportionate amount of crime.
A relevant analysis contrasted two studies of young men. Will Cook, Paul Ormerod and Ellie Cooper got data from a Cambridge (UK) study, looking at the convictions accumulated by young, urban working-class males over 20 years. Their other sample was young men’s self-reports of criminal behaviour in Pittsburgh (US). Both samples looked at young males considered “at risk”.
Despite fundamental differences in approach, not to mention geography, in both samples close to two-thirds of the young men did not offend – measured either through self-report or convictions. In both samples a few individuals accounted for large amounts of offending (self-reported or convictions).
Excluding the non-offenders, the number of criminal acts by individuals (from maximum to minimum) resulted in a “power law” fit.
Getting yet more macabre, does this apply to violent crime?
A 2014 review of over two million Swedes compared those with three or more violent offences with those with one or two, and with those without any. “The distribution of convictions was highly skewed,” report Orjan Falk and his co-researchers. One percent of the population accounted for 63.2% of violent convictions. The top two factors accounting for violence – being male and personality disordered.
Once started on a criminal career – a few are responsible for a great deal of offending. In the case of violent offending – a few are responsible for severe violence. Even homicide.
The goal must be minimising the number of those who start such a career. That means helping the vulnerable, whether because of their social environment (living in at-risk neighbourhoods for example), or because of what they have learned in often violent childhoods.