
Peak murder
Peak murder
Why did murder peak during the 1980s and 1990s?

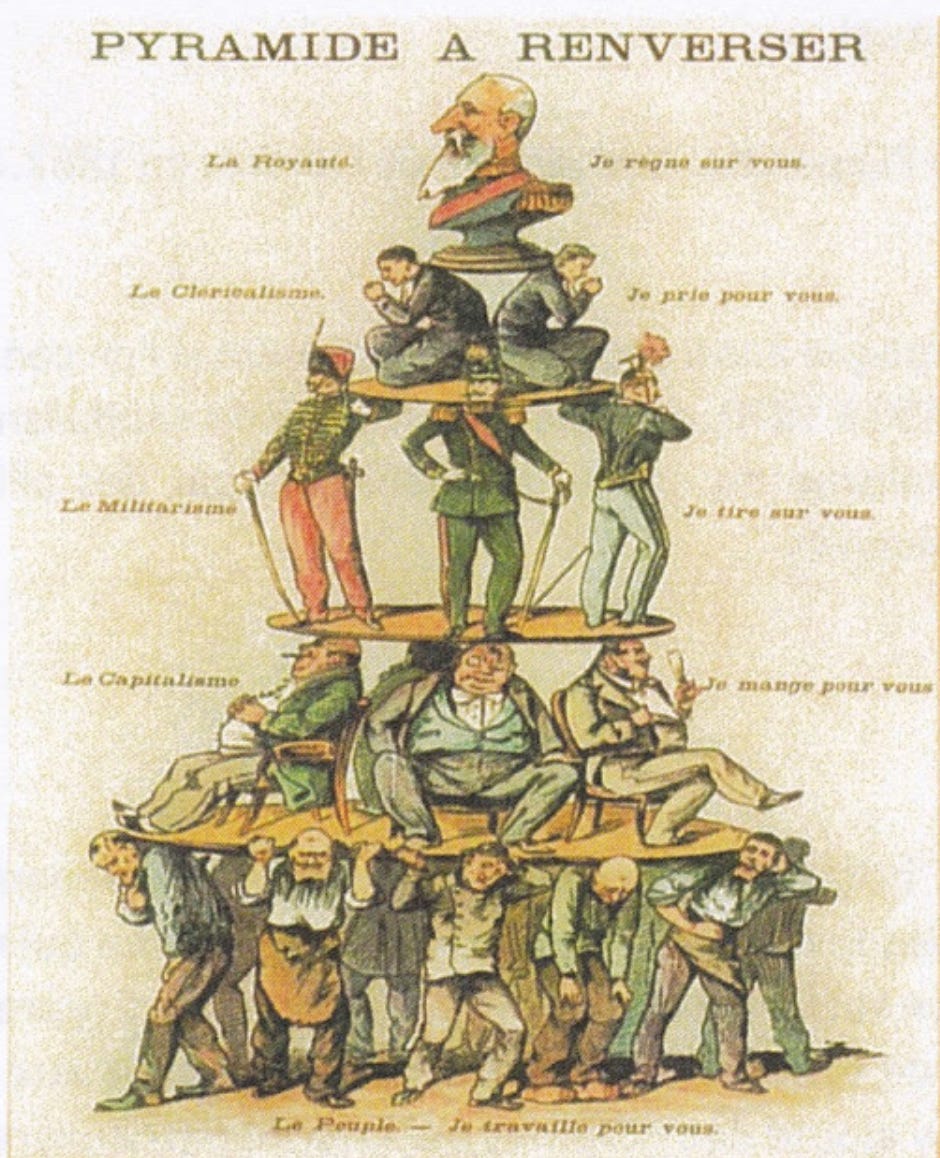
image: Wikipedia Commons
The murder rate took off in the 1980s, reaching a peak (from 1985 to 1992) not seen in New Zealand since colonial days. Homicide then started a gradual decline to the reasonably consistent levels of the present era.
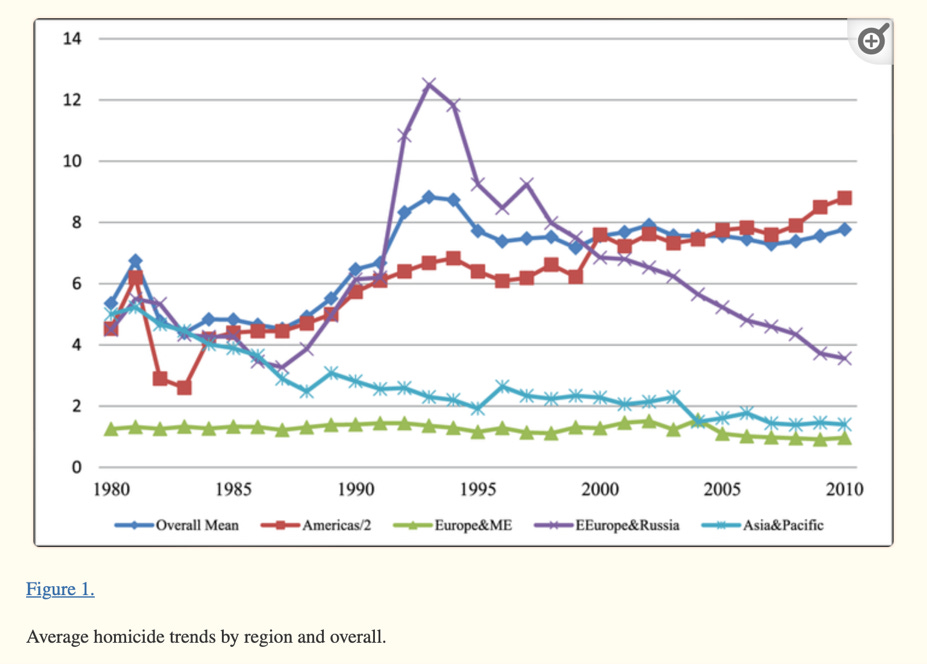
Many other countries showed the same serious bump in homicide rates over this period. James Tuttle of the University of Montana and colleagues looked across 82 countries, to identify which groups of countries showed this peak in murder. This figure is from their 2018 paper; that while the ‘overall mean’ of homicide across countries (the blue line) shows a peak, this trend is more pronounced in ‘Eastern Europe and Russia’ and the ‘Americas’ (where murder kept rising after 2000).
There are two consistent results which distinguish high from low zones of homicide (within as well as between countries). High inequality and low social capital result in higher murder rates.
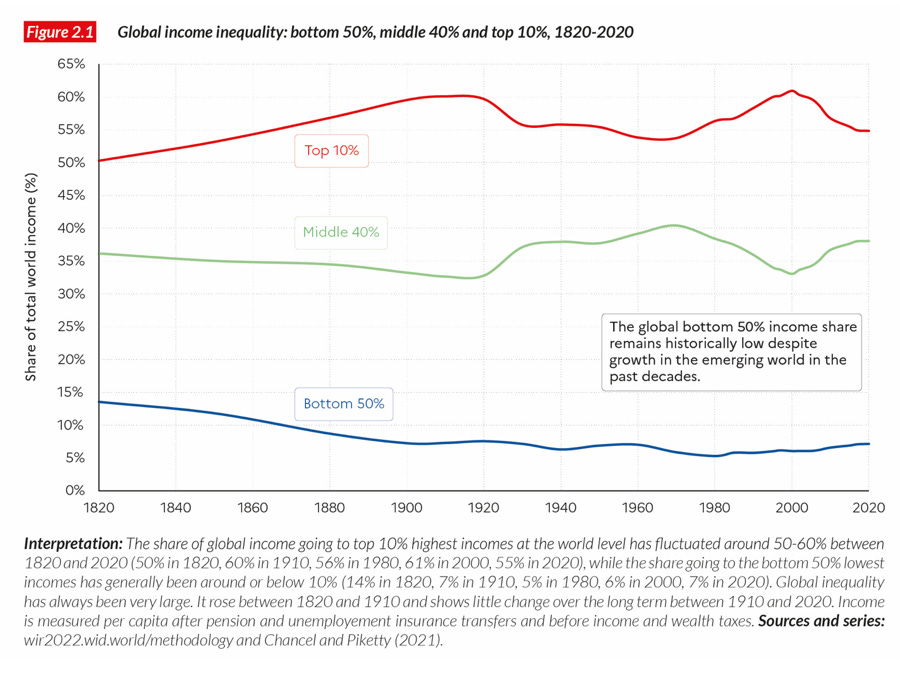
Neoliberal policies of the 1980s drove increased inequality. Fewer people gained a greater share – earning more and accumulating more wealth. The chart from the World Inequality Report shows the increase in global income inequality – particularly the higher earnings of the ‘top 10%’ during 1980-1990, peaking in 2000. There is a just-noticeable drop in the earnings of the ‘bottom 50’ over this period (at their minimum in the early 1980s) and a clearer drop for the ‘middle 40%’.
There is a match in the trends over time between the global rise in inequality and the overall mean rise in homicide.
At the bottom of the social hierarchy, increasing inequality means more people are competing for fewer resources. As the competitive stakes rise there is more male-on-male competition, more violence and more homicide.
What is the impact of social capital on homicide? Social capital reduces homicide because trust in institutions, especially police and the rule of law, results in better management of violence. Instead of violence, even lethal violence, leading to revenge or payback (known as “self-help’ justice), such violations of agreed norms are managed through recourse to accepted legal institutions. The process of having agreed standards, and shared belief in institutional remedies is based on social capital – members of the community trust these approaches.
Frank Eiger and Nicole Aitken sampled 33 countries (including New Zealand) during 2006 and found that differences in homicide rates was predicted by income inequality and trust (measured via wide-scale surveys asking questions such as “there are only a few people I can trust completely”). These were large relationships – inequality and social capital explained nearly two-thirds (64%) and one-third (34%) of the variation in rates of homicide.
Let's look at Finland (along with other Scandinavian countries Finland has low inequality, high trust and low homicide). In surveys, 96% of Finns believe they know someone they could rely on in times of need (vs 91% average for OECD countries). Their satisfaction with life is 79% (67% for the OECD average). The Gini coefficient measure of income inequality for Finland is 25.7 (11th down from the most equal country). Homicide is 1.2 / 100,000 (around 1.0 is the most common rate for OECD countries – the average is higher, pushed up by a few very high rates).
South Africa is one of the most economically unequal societies (in 2014), with a Gini coefficient of 63%. That means the top 1% of earners take home 20% of the nation’s income; the top 10% over half, or 65% of income. Social capital was measured in a recent paper, which included similar questions about trust to those asked in the OECD survey – the average trust rating was 11%. Such a low rating could be the result of issues around racial disparities and corruption. Homicide in South Africa is 42 per 100,000 – 35 times higher than in Finland.
For reference – New Zealand is ranked 56th for inequality, with a Gini coefficient of 33.9. A paper on social capital in New Zealand by Simon Chapple and Kate Pickett reported a 2019 trust rating of 57% (in response to “In general how much do you trust most people?”). The New Zealand homicide rate has been around 1 in recent years (with the exception of the rate above 2 in 2019 ; due to the mosque murders)..
I considered what impact inequality has had on homicide rates in New Zealand over 95 years. I used two measures of inequality. It has not been possible to locate a measure of social capital that covers the same period.
The chart shows New Zealand’s homicide rate from 1926 (as far back as reliable records go). This grey line clearly shows the peak in homicide, around 2 per 100,000, from 1985 to 1992.
Tony Atkinson and Andrew Leigh developed an income inequality measure for the years 1921 to 2002. This is shown as a blue line in the chart. This line shows two dips, with peaks in income inequality in the 1950s and the 1990s. This measure of income inequality is in moderate sync with the homicide trends – income inequality was going down after the 1950s, and so was the homicide rate. However, the rise in income inequality from the early 1990s lags behind rising rates of homicide.
The final, orange line, shows a more stark indicator of inequality. Māori infant mortality has been consistently higher than infant mortality for Non-Māori since records began. From the 1920s to the 1950s the ratio of Māori infant mortality to the total infant mortality was over 2:1, or two Māori infants died relative to one death for all infants. From the 1950s to the early 1970’s Māori infant mortality, while still higher than that for Non-Māori, started to drop towards that lower rate, approaching parity of 1.0. That trend reversed in the late 70s; gains in the health of Māori infants reversed relative to Non-Māori. That trend continued until 1990 when Māori infant mortality again started to drop closer to Non-Māori levels.
This ratio of the infant mortality of Māori relative to the others is an indication of the impact of inequality. While income inequality measures the advantage enjoyed by those receiving a pay packet, differences in infant mortality indicate the life outcomes of a variety of forms of inequality. Māori are a cultural group who are constrained at the bottom of the social hierarchy by limited access to educational, occupational and also health services.
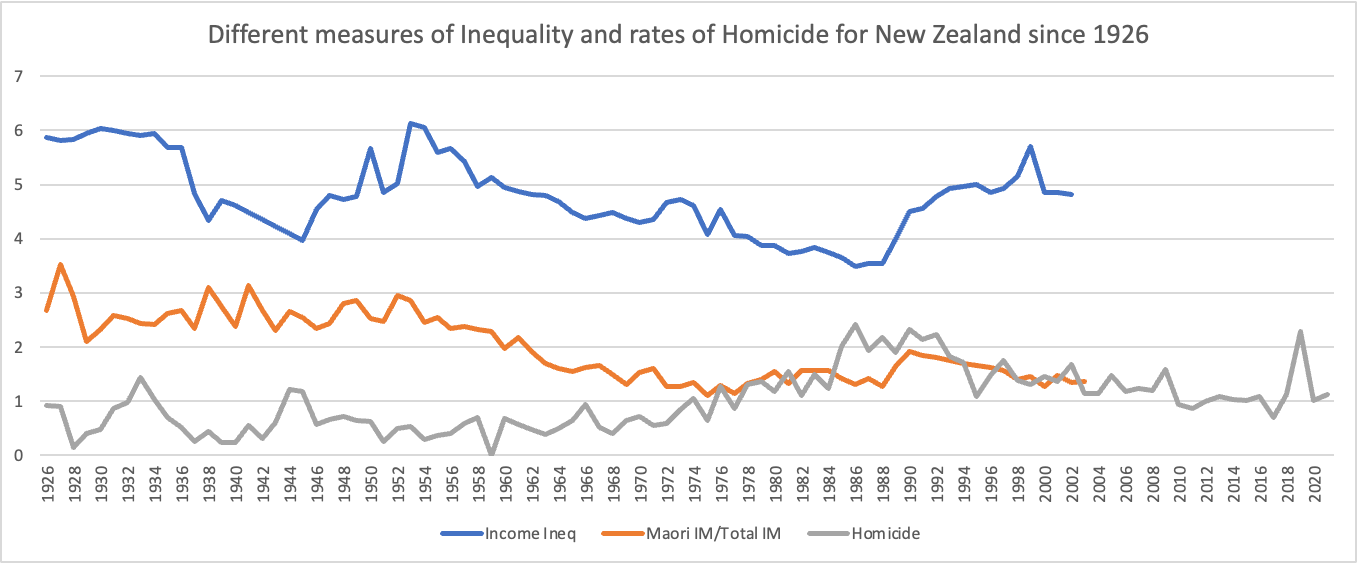
There is a tighter sync between trends in the infant mortality ratio and homicide rates. When the infant mortality ratio shows relatively more Māori infants dying (from the late 1970s), homicide rates are going up. When this infant mortality ratio reverses, homicide starts to decline.
This is not to imply that only Māori are affected. The infant mortality ratio is an indicator (although a strong one) that the world is getting worse for those at the bottom, resulting in more men using violence as a way to maintain their position in that super-competitive world.
This can be summarised statistically. Multiple regression of both of the inequality measures onto New Zealand’s homicide rates results in an ‘R2’ measure of 27% - meaning these measures of inequality explain over one-quarter of the changes in homicide rates. Changes in the homicide rate was significantly related to the infant mortality ratio, but not significantly related to the measure of income inequality.
This is more evidence that social inequality has seriously bad impacts. Sadly one of these impacts is using increases in violence to stigmatise and further limit opportunities for those at the bottom of the hierarchy. Dealing with root causes – through structural changes to the sources of entrenched inequality – is the more equitable solution.