
Social forces and murder
Social forces and murder
What is driving up murder rates? And what is driving them down?


Image: yourmechanic.com
Murder is shocking. How could that happen? What triggered it? Looking deeper we might see indications of the disordered thinking of the perpetrator. Maybe jealous rumination or paranoid beliefs. We might see evidence of boundary battles between feuding criminal groups. Or the greedy motives of a predator.
We are inclined to an individualistic take on such crime. After all, our life might depend on spotting the risk from some random, or not-so-random malcontent. Certainly, the lives of our ancestors did – and we have inherited their very useful alarm systems.
What about looking at the broader social context of murder? We might look at a graph of New Zealand murder rates (the orange line below, we’ll get into the blue Crime rate line soon) and see that these rates of murder run up at the end of the 20th century (reaching a high level of around 20 per 100,000), and then decline. What is going on?
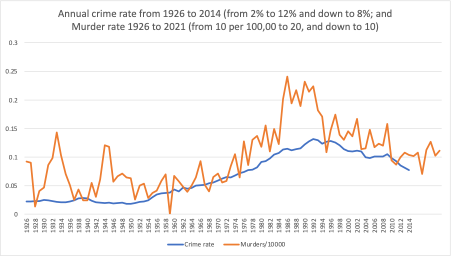
But this peak in murder is not just a New Zealand thing. Intriguingly this is a general phenomenon. Across other “Western” countries – there was the same increase, of violent as well as most other crimes around the end of the 1990s, and then a twentieth-century drop.
Here’s an illustration from the United States showing both types of crime peaking in the early 1990s, with violent crime a little after the other crimes.
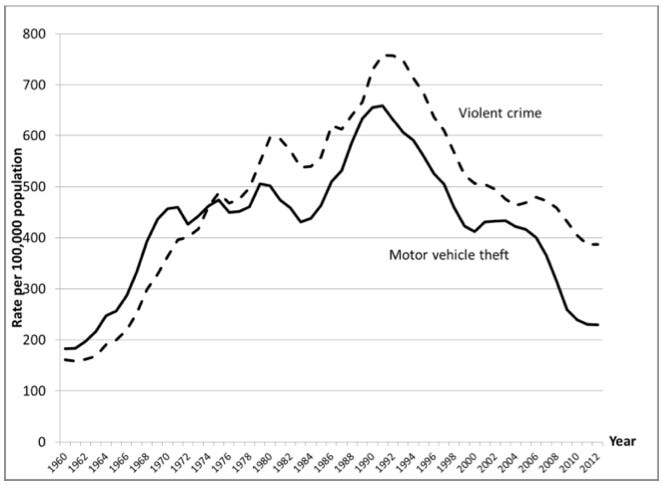
Violent crime (including homicide) and motor vehicle theft rates per 100,000 population (for 1960-2012, from United States Uniform Crime Reports, reproduced from Farrell, Tilley and Tseloni, undated).
The same phenomenon is seen across Europe and Australia.
A review by Graham Farrell, Nick Tilley and Andromachi Tseloni looks at different theories for this rise and drop in (some) crime rates across the West. They look at seventeen theories. But only one of these 17 hypotheses stands up to their tests.
I have cut and pasted the next two charts from this paper by Farrell and colleagues. First, the 17 hypotheses. These have been covered in a range of scientific and popular publications. You will notice that some of these are popular refrains of present-day politicians; imprisonment and policing strategies for example.
Which one of these do you think is most likely to explain the bump in crime, including violent crime?

Seventeen hypotheses for the rise and then drop in crime in Western countries
Farrell and his co-authors put these 17 to four tests.
1. The cross-national test. Given that this peak in crime is seen across so many countries – it is not useful to have an explanation that only works in one or some of those. For example, the US introduced more aggressive policing over the period when crime dropped. Canada didn’t. It’s hard to see how aggressive policing made a difference if Canada’s crime rate went down without the same policing as the US.
2. The prior crime increase test. Across many countries, crime had been increasing for decades before the 1990s peak and decline. The explanation should fit with this. For example GDP was variable before the 1990s, but then increased from the mid 1970s to the early 80s. GDP continued this upward trend during peak murder (1984-1992), then kept on going up in the late 90s and early noughties. Overall economic growth continued but murder and crime overall went up before peaking and heading down. It’s difficult to see any sort of connection between economic growth and crime.
3. The e-crimes and phone theft test. This type of crime has increased in recent decades, against the generally downward trend in crime. The hypothesis needs to explain this exception. For example changes in demographics, abortion and levels of lead could explain reductions in crime, but they do not explain the exception of increased theft of smart phones.
4. Different trajectories of the reduction in crime. For example the drop in property crime preceded the drop in violent crime in all countries. (The NZ graph shows all crime as well as murder – so property and violent offenses are combined in the blue line.) Generally the hypotheses do not explain this sequencing. For example if a strong economy reduces crime levels – why would violent crime take longer to begin dropping?
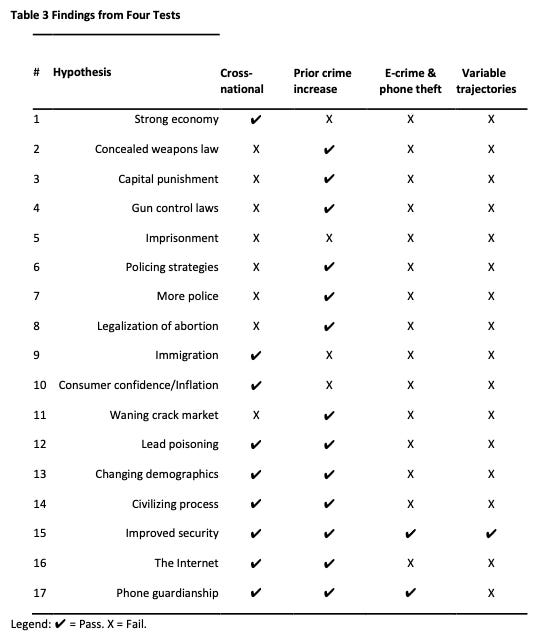
Review of the 17 hypotheses in terms of four reality checks or tests
Only one of the 14 hypotheses makes it through all four tests. Improving security has consistently led to crime reduction. Studies across Australia, England and Wales, the Netherlands and the United States find that vehicle security (such as electric immobilizers and central deadlocks) led to declines in vehicle crime. Similarly, there are strong indications that improved household security has resulted in lower household burglary. There has not been a comparable increase in smartphone security – they remain an enticing opportunity.
How does this hypothesis fit with the (later) drop in violent crime? Less opportunity for property crime reduces the risk of violent crime. Young men (the leading demographic for violent offending) are less likely to be out joyriding and so less likely to bump into other young males.
Andromachi Tseloni also makes the point (in a 31 January 2024 contribution to the BBC More or Less podcast), that socializing by young people is now more mixed (in England anyway). That means fewer young, alcohol-disinhibited males in fewer fights.
To point to centrally locked cars as a reason for not only less crime but also less violent crime is only part of the explanation. Farrell and his colleagues suggest that less opportunity for crime leads to a lower likelihood of young men embarking on a criminal career.
In a future Newsletter I will describe my work looking at social explanations that explain New Zealand murder trends. But it is incredible to see the interconnectedness of our social system – and the potential for good outcomes.